
This research aims to understand the role of station ownership in local news stations’ discussion of vaccinations during the ongoing COVID-19 pandemic. Past research tells us that a large proportion of the US population gets public health information from local news, with those who get COVID-19 vaccine information from local news expressing greater intent to get a COVID-19 vaccine than those who did not get their information from local TV, regardless of how much they trusted the vaccine information (Piltch-Loeb et al. 2021; Nagler et al. 2020; Hamel et al. 2021; Gollust, Fowler, and Niederdeppe 2019). Clearly, local news has power in sharing public health information.
However, in the last few decades, many local television stations have gone through corporate acquisitions. One example of this is the Sinclair Broadcasting Group, which has seen much attention. The company’s conservative political lean has raised concern around corporate ownership’s effect on local news, particularly since Sinclair is the largest of the local television conglomerates, reaches 40% of Americans, and often presents news as controversial entertainment to audiences that are already more conservative (Levendusky 2022; Hedding et al. 2019; Tryon 2020). Indeed, causal estimates find that counties show a higher presidential Republican vote share for each year they have had a Sinclair affiliate station (Miho 2020).
Local news stations’ Sinclair ownership may predict the ways they cover health-protective behaviors such as vaccination during the COVID-19 pandemic. In the 2022 working paper Politicizing Masks? Examining the Volume and Content of Local News Coverage of Face Coverings in the U.S. through the COVID-19 Pandemic, authors Neumann et al. find that local news coverage of face masks varies based on both Sinclair ownership and media market demographics. Interestingly, Neumann et al. find a minimal and time-variant relationship between media market-level viewing audience partisanship and politicization, as well as media market-level viewing audience partisanship and volume of local news coverage of COVID-19 face masks, suggesting that station ownership is one of the strongest determinants of local news politicization throughout the COVID-19 pandemic (Neumann et al. 2022). By combining findings on prior coverage of vaccination efforts and the nationalization of local news, we can see the high potential for polarized and politicized local news coverage by Sinclair Broadcasting Group throughout the COVID-19 pandemic. This could in turn affect viewers’ health-protective behaviors, which has wide-ranging consequences for the American public as the COVID-19 pandemic continues.
To further understand conglomerate-owned local news stations’ coverage of the pandemic, I explore the volume and content of vaccine-related stories by local news stations between September 2020 and December 2021. By quantifying controversy and partisan controversy, I identify differences in politicization and partisanship between conglomerate-owned and non-conglomerate-owned local news stations, as well as assess how coverage of vaccines changes over time and in response to local COVID-19 case rates.
THIS PROJECT
In this project, I replicate Neumann et al.’s methods to explore local news stations’ vaccine-related coverage and understand the extent to which Sinclair station ownership is associated with the volume and content of programming. Specifically, I ask the following questions:
- RQ1: How does the volume and content of coverage vary based on COVID-19 case rates?
- RQ2: How did controversy in vaccine-related stories vary, both over time and by Sinclair ownership?
- RQ3: Was Sinclair ownership associated with stations’ average daily volume of vaccine-related stories?
- RQ4: To what extent did sentiment differ in Sinclair vs. non-Sinclair stations’ stories during May 2021, the first full month that all US adults were eligible for COVID-19 vaccines?
My hypotheses are based in part on the findings of Neumann et al. I expect that case rates will predict the volume and content of coverage, Sinclair stations will show lower story volume and higher controversy, and there will be differences in story sentiment by Sinclair ownership.
Data
In brief, the corpus for this project consists of local television news’ closed captions from September 1, 2020, to December 31, 2021. I use a keyword approach to identify news stories related to vaccines and vaccination, then aggregate the story volume at the news station and national levels to create a two-sided seven-day moving average used in the analysis. I follow a similar approach to classify the stories as controversial and as containing partisan cues. I also perform sentiment analysis on a subset of the data from May 1 to 31, 2021, the first month that COVID-19 vaccines were available to all American adults. I aggregate the sentiment ratings to the station-date level to create a two-sided seven-day moving average. Independent variables include a measure of Sinclair station ownership, two-sided 7-day rolling averages of stations’ local case counts, two measures of voting partisanship, and media market demographic information. See the methods section at the end of this blog post for full methodological details, including data sources.
I start with descriptive statistics, which allow me to understand the data’s behavior during my time period of interest. Then, I combine additional descriptive statistics with simple linear regressions to begin focusing on the relationships between Sinclair station ownership and volume, controversy, and sentiment. Lastly, I predict story volume and controversy using the R package lme4, which lets me estimate linear mixed-effects models with random intercepts to account for variance. (As Neumann et al. note, several variables (e.g., Trump vote share) prevent the use of fixed effects because they are constant within units. The random effects prove useful in this case, as they allow both Neumann et al. and me to account for variance that cannot reasonably be operationalized, such as local/market-level events.) With these combined methods, I explore controversy in local television news coverage of vaccines, focusing on Sinclair station ownership as a potential predictor of both story volume and controversy.
RESULTS
Descriptive Findings
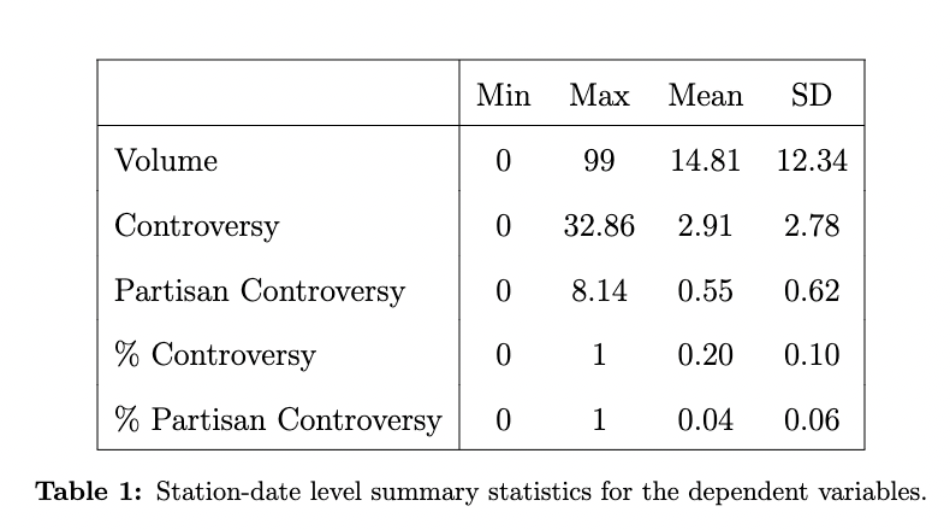
Local television news stations covered the issue of COVID-19 vaccines to different degrees, and the volume and proportion of controversy and partisan controversy varied across coverage. As shown in Table 1, the daily volume of all vaccine stories ranged from 0 to 99, with an average of 14.81 daily stories per station mentioning vaccines. In comparison, Neumann et al. find an average of 7.33 daily stories per station mentioning masks. Of the vaccine stories, an average of almost 3 per day, or 20% of stories, contained controversy, but far less––an average 4% of daily vaccine stories––contained partisan controversy. See Table 1 for full descriptive statistics at the station-date level.
The average number of daily vaccine stories was higher in May 2021, the first month that COVID-19 vaccines were available to all adults in the US, for an average of 19.22 daily stories per station. However, the average daily percentage of stories containing controversy (19% of stories) and partisan controversy (3%) remained consistent. This suggests that while stations may have aired more programming referencing COVID-19 vaccines in May 2021, the content of their programming remained consistent with other months. Daily sentiment in May 2021 vaccine stories leaned positive, and daily sentiment scores ranged from -0.08 to 0.92 with an average of 0.52, placing the average story halfway between a neutral and positive classification. See Table 2 for full May 2021 descriptive statistics at the station-date level.
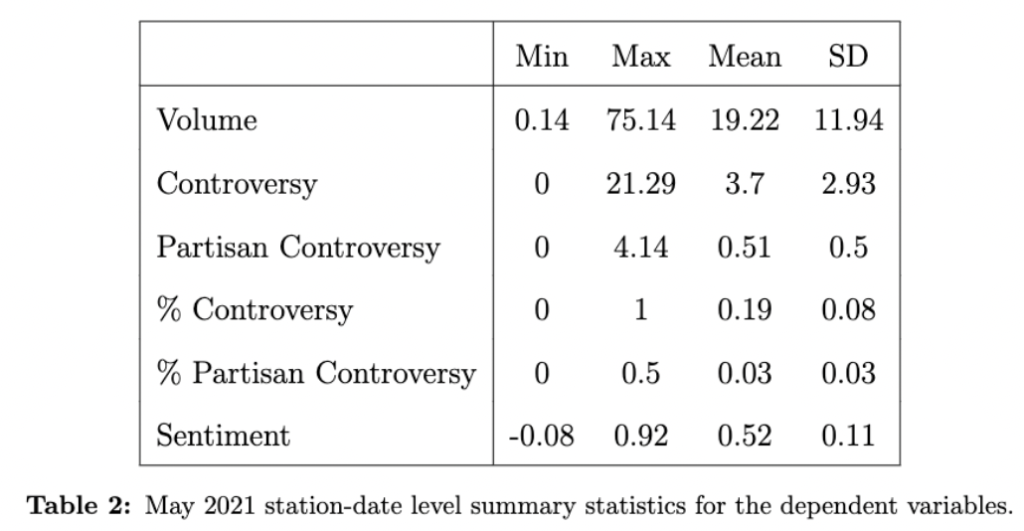
Figure 1 shows the 7-day rolling average volume of vaccine stories and COVID-19 cases, with vertical lines referencing events related to the national vaccine rollout or phases of the pandemic. As expected, the rises of the increasingly-contagious Delta and Omicron variants precede a rise in COVID-19 cases. Though it is difficult to pinpoint specific events as triggers for increased coverage of vaccines, it is helpful to see, for example, that the December 2020 peak in vaccine stories coincides with the initial availability of COVID-19 vaccines in the US. The overall volume of vaccine stories trended upward until March 2021, then downward until July 2021, then up again until mid-August before trending slightly downward.
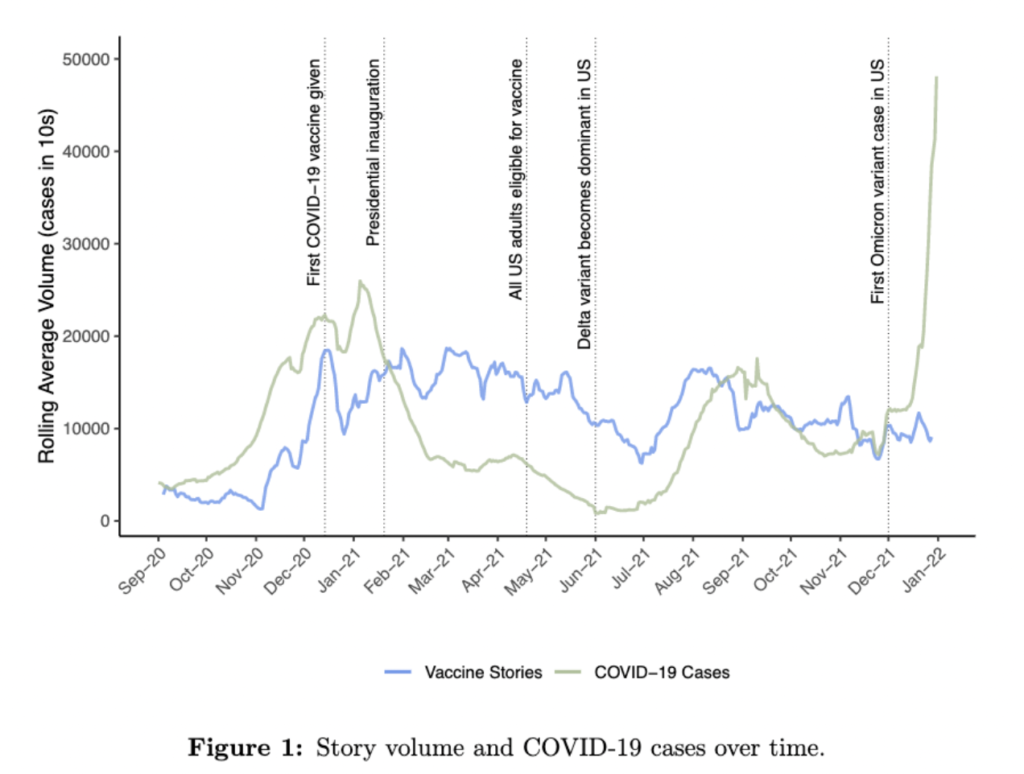
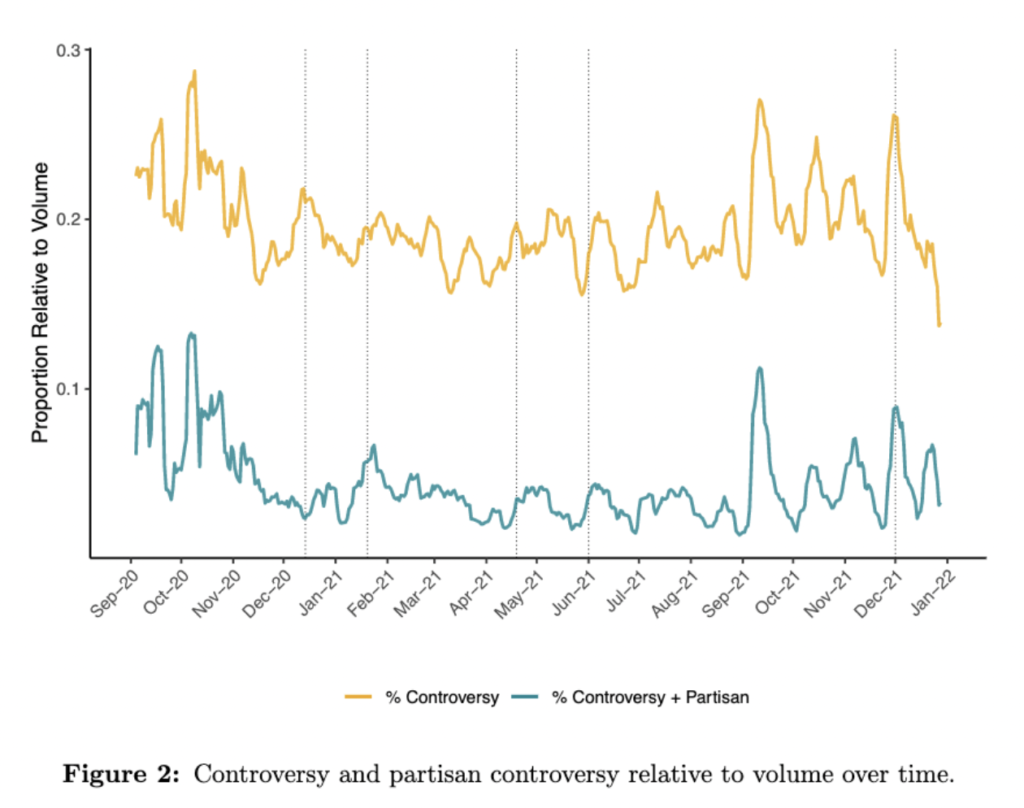
Figure 2 shows controversy and controversy combined with partisan mentions as a proportion of vaccine story volume, as well as the same event indicators as Figure 1. Relative to surrounding dates, controversy spiked in December 2020 when the first COVID-19 vaccines were administered in the US, April 2021 when all US adults become eligible for COVID-19 vaccines, and December 2021 when the first Omicron variant case was detected in the US. Also relative to the surrounding dates, controversy combined with partisan mentions spiked around the Biden Presidential Inauguration in mid-January 2021 and the first US Omicron variant case in December 2021. Most notably, both controversy and partisan controversy peak in October 2020, two months before COVID-19 vaccines were administered to any US adult, and trend sharply downward until mid-December. The second-highest peaks in both controversy and partisan controversy occur in mid-September 2021. Vaccine stories hit their lowest volume in early November 2020, which makes sense, as both local and national news coverage likely focused on elections. Controversy and partisan controversy of vaccine stories also decreased during this time.
Sinclair Station Ownership
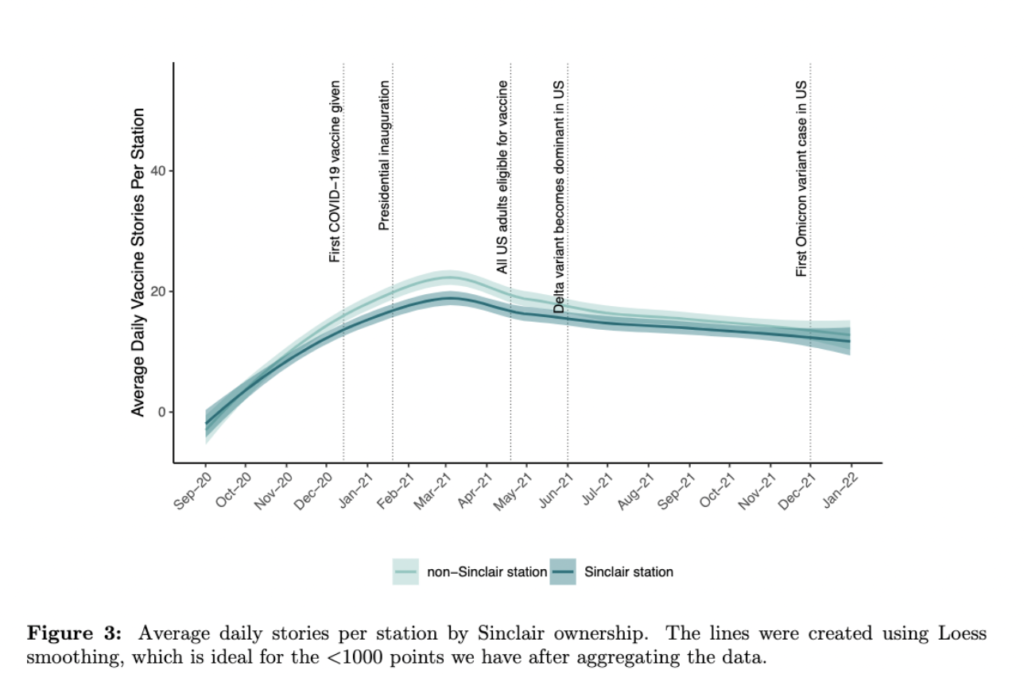
As shown in Figure 3, Sinclair station ownership appears to be associated with a lower volume of vaccine-related stories from mid-December 2020 to late April 2021. This lines up with the time period between the first COVID-19 vaccines administered and all adults becoming eligible to receive a vaccine. Both Sinclair and non-Sinclair stations’ 7-day rolling average volume of daily vaccine stories trend sharply upward until March 2021, then trend downward.
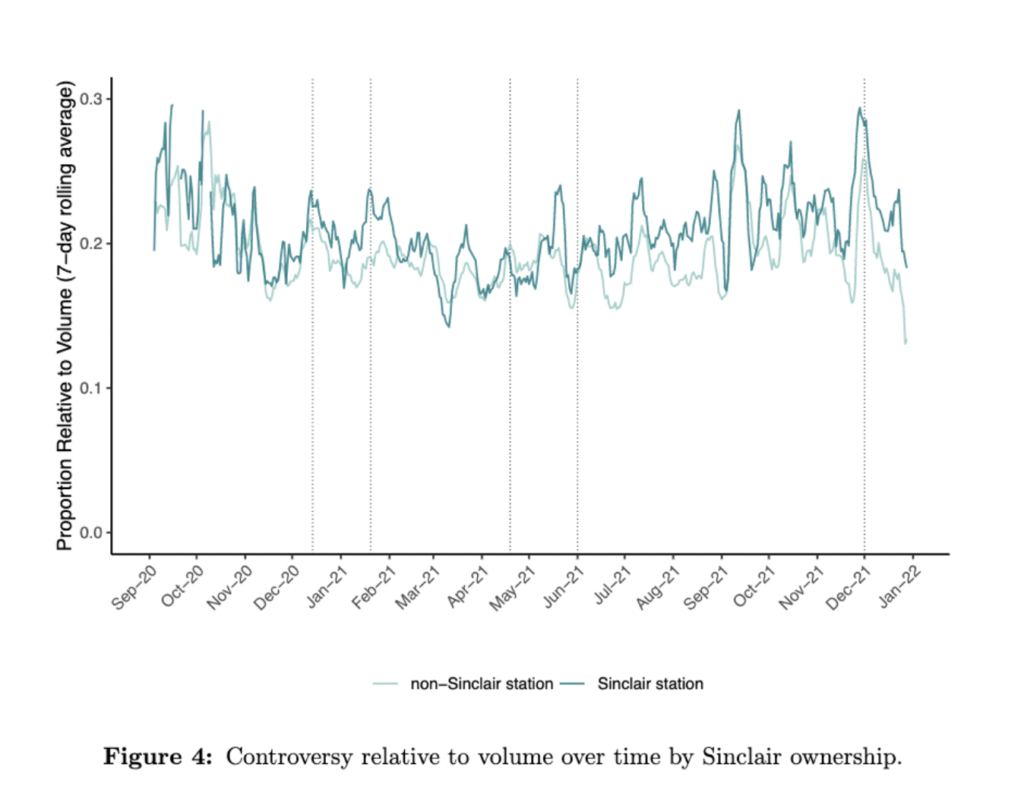
This pattern in story volume does not extend to controversy, see Figure 4 for a comparison of Sinclair vs. non-Sinclair stations’ controversy relative to their story volume. Sinclair stations appear to frequently have higher controversy than non-Sinclair stations. For example, the event lines marking the first COVID-19 vaccines administered, the Biden Presidential Inauguration, and the rise of the Omicron variant line up with periods of Sinclair stations showing higher controversy. However, there are two periods where non-Sinclair stations show slightly higher controversy: late February 2021 to early March 2021, as well as the first weeks of widespread vaccine availability in May 2021. Still, the gap between non-Sinclair stations’ higher controversy and Sinclair stations’ lower controversy is never as large as the gaps appearing when Sinclair stations’ controversy eclipses that of non-Sinclair stations. A simple linear regression supports this, showing that Sinclair stations’ stories contain 1.6 percentage points more controversy on average (𝛽 = 0.016, p < 0.001).
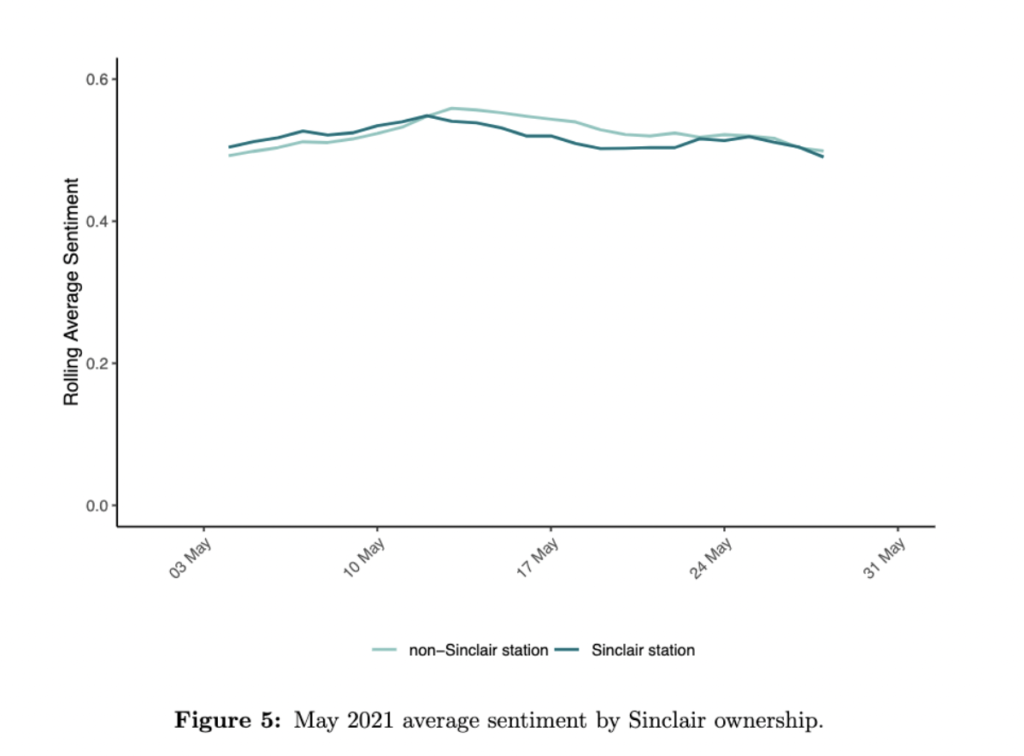
Sinclair stations’ higher controversy may not necessarily mean more negative sentiment, as shown in sentiment analysis of stories from May 2021, the first full month where all US adults were eligible for COVID-19 vaccines. Figure 5 shows minimal differences in 7-day rolling average sentiment for Sinclair vs. non-Sinclair stations during May 2021. A simple linear regression finds a significant but very small relationship between sentiment and Sinclair ownership (𝛽 = -0.006, p < 0.05). While Sinclair ownership appears to have had a negligible association with story sentiment, Sinclair stations’ stories had an average of 1.2 percentage points more controversy relative to story volume during the same month (𝛽 = 0.012, p <0.001), indicating the potential for controversy to still appear in positive programming.
Modeling Vaccine Coverage and Controversy
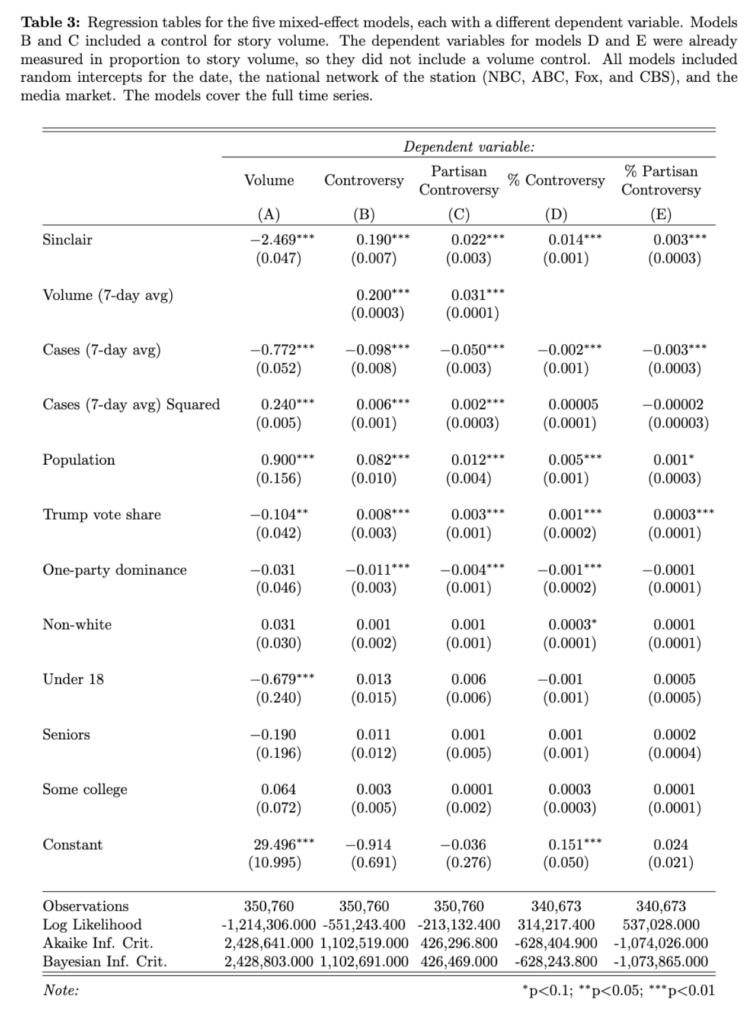
For the final stage of analysis, I used mixed-effects models to fully parse out the relationship between story volume, controversy, and Sinclair ownership in the context of the ongoing COVID-19 pandemic. That is, I accounted for COVID-19 case rates and media market demographics to isolate Sinclair ownership as an indicator of higher controversy (Figure 3) and lower story volume (Figure 4). Controversy, story volume, and station ownership were measured at the station-date level, and other predictors (e.g. case rates, population size) were measured at the media market level. Case rates were measured in 100s. The models each also include a quadratic term for case rates. Audience partisanship was measured by the media market’s 2016 vote share for Donald Trump, and one-party dominance was measured by a ‘folded’ copy of that same 2016 vote share. Demographic controls included the percentage of the population that is non-white, under 18, and seniors (over 65), as well as the percentage with some college education or more. The models all included random intercepts for the date, the national network of the station (NBC, ABC, Fox, and CBS), and the media market.
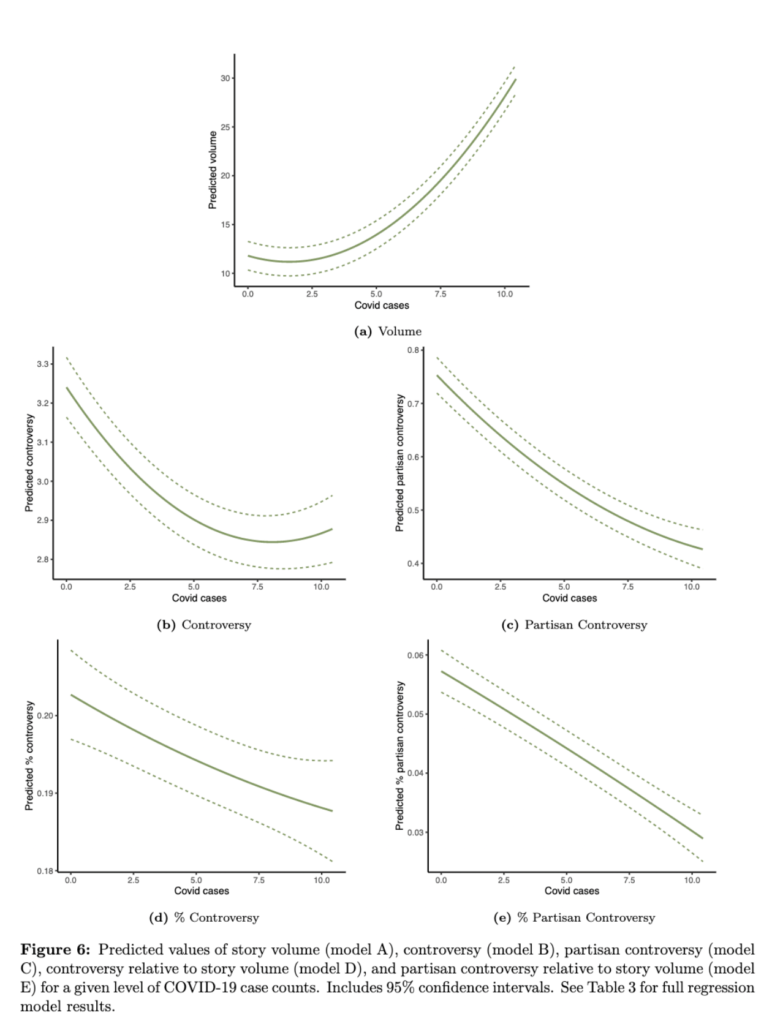
I ran five models with different dependent variables: story volume (A), controversy (B), partisan controversy (C), controversy relative to story volume (D), and partisan controversy relative to story volume (E). Models B and C included a control for story volume, but models D and E did not, as their dependent variables were already measured in proportion to story volume.
Table 3 shows the results for all models. Model A suggested a strong negative relationship between Sinclair ownership and story volume. This is consistent with my hypotheses outlined previously. Model B suggested a positive relationship between Sinclair ownership and controversy, as well as story volume and controversy. To a lesser extent, model C indicated a small positive relationship between Sinclair ownership and partisan controversy. The results of model D showed a positive relationship between Sinclair ownership and controversy relative to story volume. Likewise, model E indicated a positive, but much smaller, relationship between Sinclair ownership and partisan controversy relative to story volume.
Media market demographics predicted the models’ dependent variables to varying extents. Model A revealed a negative relationship between case rates and story volume. Models B and C, which controlled for story volume, showed negative relationships between case rates and controversy. Model A showed the largest relationships between demographic controls and a dependent variable, particularly in the cases of population size and the proportion of the population under 18. See Table 3 for full model results.
I then plotted the predictions of the quadratic term for case rates in order to answer my research question about case rates, story volume, and controversy. The positive relationship between case rates and story volume in Model A was relatively linear, as seen in Figure 6a. Model B shows a slightly U-shaped relationship between case rates and controversy, see Figure 6b, with the most controversy when cases were low. The results of model C show a relatively linear and negative relationship between case rates and partisan controversy, see Figure 6c. Models D and E, which measure controversy and partisan controversy relative to story volume, showed similar linear and negative relationships with case rates, see Figures 6d and 6e.
Across models, Sinclair station ownership was consistently one of the strongest, if not the strongest, predictors of the dependent variable. Sinclair stations were less likely to air vaccine-related stories, and when they did, the stories contained more controversy, both on their own and relative to story volume.
Limitations
These findings are not without their limitations. Specifically, I identify stories referring to vaccines and vaccination, some of which are about non-COVID-19 vaccines. For example, we can expect that some stories during the fall and winter months refer to flu vaccines. This broad approach has its strengths, as it allows me to assess how local news covered the entire topic of vaccination during a time period where health-preventative behaviors were increasingly polarized. However, it also means that I cannot separate out coverage specific to COVID-19 vaccines to compare it to non-COVID-19 vaccine coverage. And, as Neumann et al. note, errors in closed captioning could have resulted in stories being included in or excluded from the corpus, and controversy detected in stories may not be in reference to vaccines.
Like Neumann et al., my models do not provide causal evidence and use a streamlined approach in order to be more interpretable. Any potentially causal relationships between story volume, controversy, and case rates likely differ by media market. Similarly, the models do not account for local COVID-19 vaccination rates, nor qualitative influences on COVID-19 vaccination such as vaccine access, availability, and promotion. Future work should begin to parse out the relationships between local news and COVID-19 vaccination rates, but any attempts to operationalize social factors would have to be careful not to nationalize local phenomena.
DISCUSSION & CONCLUSION
In this project, I replicate Neumann et al.’s methods to examine local news stations’ vaccine-related coverage, aiming to understand the relationship between Sinclair station ownership and the volume and content of vaccine-related programming. My findings show that local television news stations frequently referenced vaccines in their programming. Despite the differences in story volume between Sinclair and non-Sinclair stations, local television news viewers as a whole were exposed to an average of almost 15 daily stories per station related to vaccines––this is double the average number of mask-related stories found by Neumann et al. However, contrary to my expectations, local COVID-19 case rates predicted lower story volume (RQ1). Controversy, and to a lesser extent, partisan controversy, fluctuated over time, sometimes in accordance with events related to the national vaccine rollout or phases of the pandemic.
As expected, Sinclair stations show higher controversy and partisan controversy in their stories. Gaps in controversy between Sinclair and non-Sinclair stations appear around the times when the first COVID-19 vaccines were administered, the Biden Presidential Inauguration, and the rise of the Omicron variant. After controlling for story volume and media market factors, there is still a positive relationship between Sinclair ownership and controversy, as well as Sinclair ownership and partisan controversy. Station ownership also predicts, to a lesser extent, both controversy and partisan controversy relative to story volume (RQ2). Sinclair stations show a lower average daily volume of vaccine-related stories, particularly between mid-December 2020 and late April 2021. This negative relationship persists after controlling for media market factors (RQ3). Sentiment differs just slightly in Sinclair vs. non-Sinclair stations’ stories during May 2021 despite a gap in controversy during that time, suggesting that overwhelmingly positive programming can still contain controversy (RQ4).
My findings suggest that local news stations have talked about vaccination a great deal throughout the COVID-19 pandemic. Further research should explore the content of the controversy found in 20% of stories in this project, the content of the partisan controversy in 4% of stories, and the relationships between stories’ sentiment and controversy.
Overall, this research is consistent with past findings, including Neumann et al., which conclude that Sinclair viewers’ local news experience involves a higher degree of politicization (Neumann et al. 2022; Miho 2020; Levendusky 2022; Hedding et al. 2019). The 2020 presidential election, though marked by the politicization of the COVID-19 pandemic, occurred before vaccines were available to the American public. It is thus not yet clear the extent to which vaccine-related politicization, particularly in ideologically distinctive local and national television programming, will affect voting intentions in the 2022 midterm elections and beyond.
METHODS
The data for this project comes from several sources, all used by Neumann et al. The corpus is made up of local television news’ closed captions from TVEyes via the Wesleyan Media Project. County-level COVID-19 case counts come from The New York Times; information about regional media markets’ voting partisanship comes from David Leip’s Atlas of U.S. Presidential Elections; and county-level demographic information comes from the 2018 American Community Survey via IPUMS (“Cases and Deaths Rolling Averages and Anomalous Days” 2021; Leip n.d.; “U.S. Census Data for Social, Economic, And Health Research” n.d.).
I restrict the corpus by date, programming type, and parent network. Specifically, I focus on data from September 1, 2020, to December 31, 2021. The corpus contains local programming from all hours of the day classified as ‘news’ by TVEyes. Like Neumann et al., I exclude programming with ‘national’ or ‘world’ in the title and limit the corpus to local programming, defined as any program that runs in fewer than 8 markets on any given day (like Neumann et al., I still include “Eyewitness News at 6″ even though it runs in more than 8 markets). Lastly, I limit the data to the 749 stations affiliated with one of the four major television networks (ABC, CBS, NBC, and Fox), which each have local stations across the 210 media markets. After these limitations, I am left with closed caption text from 10,654,654 programs.
Story Identification
I use the keyword vaccin* to identify stories related to vaccines and vaccination. Following the method of Neumann et al., I divide the program text into “stories” by tokenizing the text, then selecting instances of the keyword and 50 words on either side of each keyword. If any of the 50 words on either side are also a keyword, I select 50 additional words in the direction of the new word such that overlapping sections are merged. This continues until all keywords are selected and have a 50-word buffer on either side. At this stage, the corpus contains 5,300,017 stories.
Importantly, I choose to select all stories referencing vaccines and vaccination, which means that some stories in the corpus are about non-COVID-19 vaccines (e.g. flu, HPV). I do this because (a) controversy around vaccines during the COVID-19 pandemic often extends to non-COVID-19 vaccines and (b) local news programming may refer broadly to “vaccination” without specifying the type of vaccine. Limiting the data to mentions of COVID-19 vaccines would thus create a less nuanced analysis of how local news programming discusses vaccination as a whole throughout a pandemic.
Measurement – Dependent Variables
Controversy. I then classify the stories as controversial with another keyword approach, using the same tokens as Neumann et al. (drawing heavily from Atkinson 2017). Stories are classified as containing controversy if they contain any of the following keywords:
controvers*, disagree*, disput*, debat*, question*, dissent*, battl*, fight*, attack*, argu*, enemies, enemy, tension, heated, hotly, conflict*, contested, contentious*, contempt*, showdown, rift, wrath, explod*, erupt*, divis*, divide*, scorn*, angry, anger, opponent*, opposition, struggl*, clash*, bicker*, competing
The volume of controversial stories is aggregated at both news station and national levels to create a two-sided seven-day moving average used in the analyses.
Partisan Cues. Similarly, I classify stories as containing partisan references if they contain any of the following keywords related to national political parties and leaders:
Democrat*, Biden, Pelosi, Schumer, Harris, DFL (Minnesota Democratic-Farmer-Labor Party), D-NPL (North Dakota Democratic-Nonpartisan League Party)
Republican*, Trump, McCarthy, McConnell, Pence, GOP
Partisan cues are also aggregated at station and national levels to create a two-sided seven-day moving average used in the analysis.
Sentiment. I perform sentiment analysis on a subset of the data from May 1 to 31, 2021, the first month that COVID-19 vaccines were available to all American adults. The subset consists of 403,776 stories. The BERTweet pre-trained language model classifies each story’s sentiment as positive, neutral, or negative and provides a probability measure for the classification (Nguyen, Vu, and Tuan Nguyen 2020). I recode the classifications as 1 (positive), 0 (neutral), and -1 (negative), then multiply stories’ numeric classification by their probability score to create a quantitative sentiment scale. Story-level sentiment ratings in this subset range from -0.99 (almost certainly negative) to 0.98 (almost certainly positive) with a mean of 0.53. The potential range is still -1 to 1, but BERTweet’s probability scores cannot realistically be 1, so this prevents a ‘perfect’ negative or positive classification. These sentiment ratings are then aggregated to the station-date level to create a two-sided seven-day moving average used in the analysis.
Measurement – Independent Variables
Sinclair Station Ownership. As Sinclair station ownership is a key component of my analyses, I include a measure of whether or not a station is owned by Sinclair Broadcasting Group. This information is from BIA Kelsey via the Wesleyan Media Project.
COVID-19 Case Counts. I use daily county-level data on both confirmed and probable new COVID-19 cases from The New York Times. Daily county cases are summed to the media market level to get daily case rates, which I use to calculate a two-sided 7-day rolling average used in the analysis. The two-sided 7-day rolling averages used in this project consist of data for a given day, the three prior days, and the three following days. For this reason, variables do not have rolling averages for the first and last three days in our time period of interest.
Additional Controls. I measure the political orientation of media markets using 2016 presidential election vote shares in favor of Donald Trump (Leip n.d.). I replicate Neumann et al.’s method of creating a ‘folded’ measure of 2016 Trump vote share to indicate one-part dominance in media markets, defined as . This ‘folded’ measure ranges from 0 (bipartisan balance) to 50 (partisan dominance). Media market demographic information includes the percentage of the population that is non-white, under 18, and seniors (over 65), as well as the percentage of the population with at least some college education. This information comes from the 2018 American Community Survey (ACS) and is calculated by aggregating county-level data to its respective media markets (“U.S. Census Data for Social, Economic, And Health Research” n.d.).
Sources
Atkinson, Mary Layton. 2017. Combative Politics: The Media and Public Perceptions of Lawmaking. University of Chicago Press. https://press.uchicago.edu/ucp/books/book/chicago/C/bo25681072.html.
“Cases and Deaths Rolling Averages and Anomalous Days.” 2021. GitHub. December 12, 2021. https://github.com/nytimes/covid-19-data.
Gollust, Sarah E., Erika Franklin Fowler, and Jeff Niederdeppe. 2019. “Television News Coverage of Public Health Issues and Implications for Public Health Policy and Practice.” Annual Review of Public Health 40 (April): 167–85. https://doi.org/10.1146/annurev-publhealth-040218-044017.
Hamel, Liz, Lunna Lopes, Ashley Kirzinger, Grace Sparks, Mellisha Stokes, and Mollyann Brodie. 2021. “KFF COVID-19 Vaccine Monitor: Media and Misinformation.” Kaiser Family Foundation. https://www.kff.org/coronavirus-covid-19/poll-finding/kff-covid-19-vaccine-monitor-media-and-misinformation/.
Hedding, Kylah J., Kaitlin C. Miller, Jesse Abdenour, and Justin C. Blankenship. 2019. “The Sinclair Effect: Comparing Ownership Influences on Bias in Local TV News Content.” Journal of Broadcasting & Electronic Media 63 (3): 474–93. https://doi.org/10.1080/08838151.2019.1653103.
Leip, David. n.d. “David Leip’s Atlas of U.S. Presidential Elections.” Accessed December 13, 2021. https://uselectionatlas.org/.
Levendusky, Matthew S. 2022. “How Does Local TV News Change Viewers’ Attitudes? The Case of Sinclair Broadcasting.” Political Communication 39 (1): 23–38. https://doi.org/10.1080/10584609.2021.1901807.
Miho, Antonela. 2020. “Small Screen, Big Echo? Estimating the Political Persuasion of Local Television News Bias Using Sinclair Broadcast Group as a Natural Experiment.” HAL Open Science. https://hal.archives-ouvertes.fr/hal-01896177/document.
Nagler, Rebekah H., Rachel I. Vogel, Sarah E. Gollust, Alexander J. Rothman, Erika Franklin Fowler, and Marco C. Yzer. 2020. “Public Perceptions of Conflicting Information Surrounding COVID-19: Results from a Nationally Representative Survey of U.S. Adults.” PloS One 15 (10): e0240776. https://doi.org/10.1371/journal.pone.0240776.
Neumann, Markus, Steven Moore, Pavel Oleinikov, Laura M. Baum, Yiwei Xu, Jeff Niederdeppe, Sarah E. Gollust, and Erika Franklin Fowler. 2022. “Politicizing Masks? Examining the Volume and Content of Local News Coverage of Face Coverings in the U.S. through the COVID-19 Pandemic.”
Nguyen, Dat Quoc, Thanh Vu, and Anh Tuan Nguyen. 2020. “BERTweet: A pre-trained language model for English Tweets.” In Proceedings of the 2020 Conference on Empirical Methods in Natural Language Processing: System Demonstrations. Stroudsburg, PA, USA: Association for Computational Linguistics. https://doi.org/10.18653/v1/2020.emnlp-demos.2.
Piltch-Loeb, Rachael, Elena Savoia, Beth Goldberg, Brian Hughes, Tanner Verhey, Juliette Kayyem, Cynthia Miller-Idriss, and Marcia Testa. 2021. “Examining the Effect of Information Channel on COVID-19 Vaccine Acceptance.” PloS One 16 (5): e0251095. https://doi.org/10.1371/journal.pone.0251095.
Tryon, Chuck. 2020. “Sinclair Broadcasting as Mini-Media Empire: Media Regulation, Disinfomercials, and the Rise of Trumpism.” Media Culture & Society 42 (7-8): 1377–91. https://doi.org/10.1177/0163443720939425.
“U.S. Census Data for Social, Economic, And Health Research.” n.d. IPUMS USA. Accessed December 13, 2021. https://usa.ipums.org/usa/.