By Jem Shin ’23, Latonya Smith ’24, and Emma Tuhabonye ’23
Our goal was to use deep learning-based facial recognition algorithms to determine the appearances of political leaders, candidates, and opponents in political ad images. To do this, we ran a facial recognition algorithm in Python on Snapchat political campaign ad images. This algorithm uses the method, Histogram of Oriented Gradients (HOG) (Dalal & Triggs, 2005), for face detection, and a deep convolutional neural network (CNN) model for face encoding.
We first wanted to compare the facial recognition results with setting different tolerances and comparing the results. Tolerance is equivalent to sensitivity, the lower the tolerance the more strict the algorithm is at facial comparisons. After completing the testing of tolerances 0.5, 0.6, and 0.7, we wanted to compare the accuracy of the faces found with the results from Amazon Web Services (AWS) that the Wesleyan Media Project (WMP) had previously analyzed. This allowed us to compare the open source facial recognition software and find that the tolerance .5 was the most accurate in identifying faces among the Snapchat images and videos.
Data
Our data came from Snapchat advertisements in the form of both images and videos. There were 2,314 total images and 4,045 total videos. These images and videos served as our unknown images and videos containing faces that the software would match with faces of various candidates. From the videos, we then took 17,184 total keyframes to use as the unknown images to run with the facial recognition software. The face recognition software identified known faces in these images and videos from the WMP’s collection of photos of 2020 candidates.
The biggest limit to our data and our use of it was the sheer size. We needed to run the facial recognition code locally, and even when running, it would take lots of time to finish parsing through every image and video. In addition, within the Snapchat ads themselves, we found that the ability of the program to recognize faces in the ads was impacted by the quality of the images and videos, along with how the faces were oriented (facing the camera, looking away, etc.). Among the known photos, the facial recognition program was unable to use 21 photos of candidates due to poor image quality or differing orientation of the candidates’ faces.
In addition to the new data frames we created with the recognized faces for both images and videos, we used the AWS dataset existing in the WMP database. AWS is a popular facial recognition tool that is known to be accurate, so we compared our results to the existing AWS results to see how the open source facial recognition algorithm would perform.
Methods
Images
At first, the picture is called into the code. The HOG algorithm then converts the picture to black and white and examines each pixel. By using the black and white image, the algorithm can assess how dark each pixel is compared to its surrounding pixels. After examination, the algorithm then generates an arrow, called a “gradient”, which represents the calculated graduation of the lightest side to the darkest. Once this process has been performed on every pixel the program is left with an image of gradients. The algorithm then separates the image into squares of 16 x 16 pixels. For each square, the algorithm determines the most common gradient direction and replaces that square. From each of these squares, it determined the most frequent direction and replaced that square with a gradient. This resulted in a simplified structure of the face called a HOG pattern. We compared this pattern to an already known HOG pattern.
To encode these faces, we use the deep CNN model for face detection. The algorithm was trained to identify 128 measurements (an embedding) on every face using basic image transformations such as rotation, scaling and shearing to center the images for analysis. To train the model, we will use an image of a face whose identity is known to us, another picture with the known face in a different orientation, and a picture of someone unknown. The algorithm then adjusts its neural network so that the measurements for the 2 known faces are closer and the measurements for the unknown face are farther. This process is repeated millions of times to result in a neural network that has learned how to create dependable measurements for each face.
After this, we used a classifier to match the measurements from the new test image and identify the person who matches that. The end result is the name of the person in that image.
Videos
For the Snapchat political video ads , video summarization was used to pick out key frames. The key frames were determined by the frames’ color histogram. If there was a drastic change in the color histogram, then that frame was signaled as one to be pulled into our dataset.
From the dataset of our unknown Snapchat images, we employed a Python facial recognition machine learning algorithm. (Geitgey, 2020) From the unknown images, the program uses arrows called gradients that show the direction from light to dark in each pixel of the image in comparison to those around it. From these gradients, an analysis is done on their major/most defined direction to create a simplified version of the original image for identification with a known image. The package then uses landmark estimation and extracted facial measurements to further identify the person in the unknown photo.
We did this multiple times, using eight different tolerance levels ranging from 0.25 to 0.9. The default tolerance value in the software is 0.6, and lower tolerance values make the face comparisons more strict (and vice versa for higher tolerance levels). After running the facial recognition software with multiple different tolerance levels on the images, ranging from 0.25 to 0.9, we found that the default tolerance level (0.6), along with 0.5 and 0.7 seemed the most reasonable to specifically analyze. Below 0.5, the software was missing very obvious faces (ex. Trump), but from 0.7 onwards, it would assign face matches to people in the unknown images that were very clearly incorrect. Thus, we narrowed it down to these three tolerance levels for the purposes of our analysis.
From the dataset of videos from Snapchat, we used another machine learning algorithm from python. (Zhujunnan) This program was designed to extract the key frames from each video for our analysis. Using a contiguous sequence of video frames, the algorithm analyzes the color histogram. Once there is a dramatic change in the histogram, it marks the frame and places it into our dataset. Once this was done we used the facial recognition algorithm again to analyze the frames, using the three tolerance levels of 0.5, 0.6 and 0.7.
Lastly, we compared the resulting datasets of each of the three tolerance levels for both Snapchat videos and images to the AWS data set. The AWS dataset was used as a measure for accuracy, as the large size of both the image and video data sets made it difficult to confirm by human coding how accurate the facial recognition software was.
Results
We have divided our results into sections, with the first looking at the images, the second looking at the videos, and the third looking at both our image and video results compared to the AWS results.
Image Results:
Figure 1: Count of Face Found for Snapchat Images with Tolerance 0.5

Figure 2: Count of Face Found for Snapchat Images with Tolerance 0.6

Figure 3: Count of Faces Found for Snapchat Images with Tolerance 0.7

Out of the three tolerances examined, the tolerance of .7 assigned faces to 98% of the images in the dataset. However, as we looked closer at the results, we found that these matched faces would not be very accurately recognized, so the fact that the 0.5 tolerance matched the least faces is not concerning.
Most Common Faces:
Figure 4: Faces Occurring the Most for Snapchat Images with Tolerance of .5

Figure 5: Faces Occurring the Most for Snapchat Images with Tolerance of .6

Figure 6: Faces Occurring the Most for Snapchat Images with Tolerance of .7

Each block color represents the political party each candidate belongs to.
The top 5 most commonly matched faces for the default 0.6 tolerance were Donald J. Trump, followed by James Stevens Waters, Bill Kelsey, Dave Wilson, and Jerry McNerney. For the lowest tolerance we analyzed (0.5), Donald J. Trump was still the most commonly recognized face, but was followed by Joseph R. Biden, Jerry McNerney, Cynthia Wallace, Grace Meng, and Iman-Utopia Layjou Bah. For the 0.7 tolerance, the facial recognition software matched completely different faces, with Cyrus Sajna the most commonly matched, followed by Susan Smith, Marcia Squier, Jeffrey Blunt, and John Page.
Video Results:
Figure 7: The Count of Faces Found for Video Summarization with Tolerance of .5

Figure 8: The Count of Faces Found for Video Summarization with Tolerance of .6

Figure 9: The Count of Faces Found for Video Summarization with Tolerance of .7

Once again, the 0.7 tolerance found the most faces in the dataset of video key frames. However, looking at our next set of results will show that the other tolerances were more accurate in the faces that they identified.
Most Common Faces:
Figure 10: Most Common Faces for Snapchat Video Summarization Technique Tolerance of .5

Figure 11: Most Common Faces for Snapchat Video Summarization Technique Tolerance of .6

Figure 12: Most Common Faces for Snapchat Video Summarization Technique Tolerance of .7
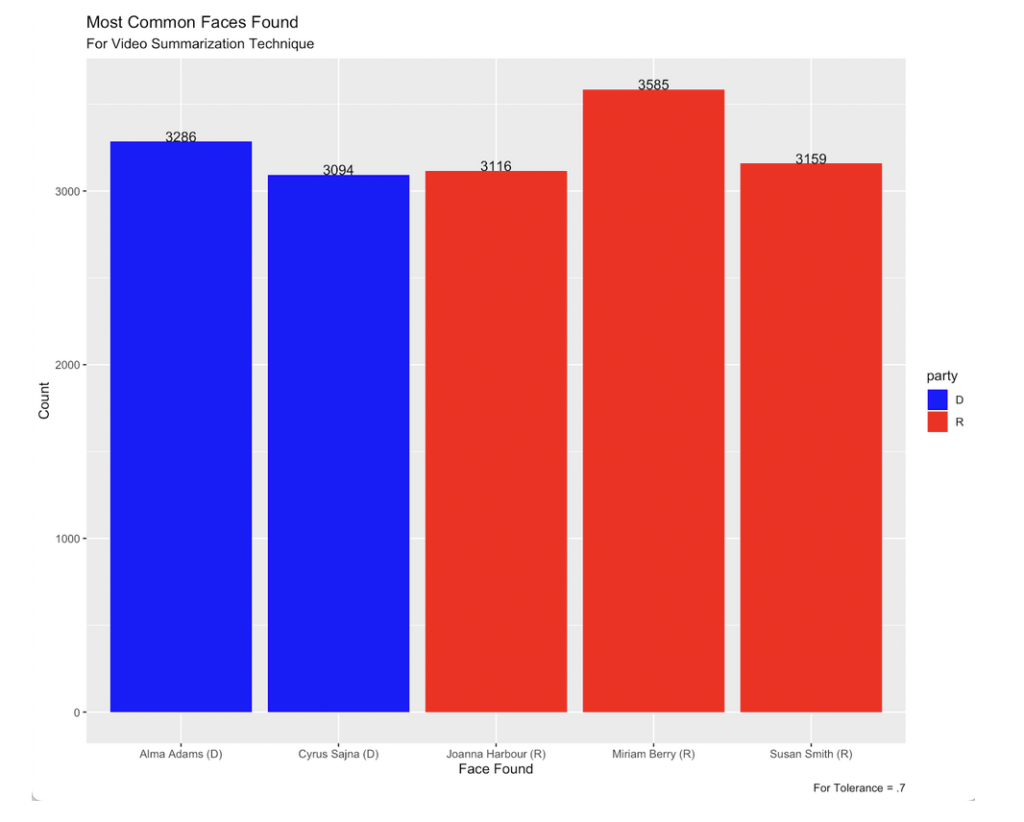
Looking at the most commonly recognized faces from the video frames, we see that Joseph R. Biden was the most commonly matched for the 0.5 tolerance, while Donald J. Trump remained the most commonly identified face in the 0.6 tolerance. For the 0.7 tolerance, we see candidates matched that were not found in either of the other tolerances. It seemed very unlikely to us that these candidates would be found in that many video ads, and the 0.5 tolerance and default tolerance of 0.7 seem to be more reliable and accurate in identifying faces for the video key frames, as with the images.
Comparing with AWS:
Figure 13: Comparing the Faces Matched Between Snapchat Image Ads with Tolerance of .5 and AWS Results
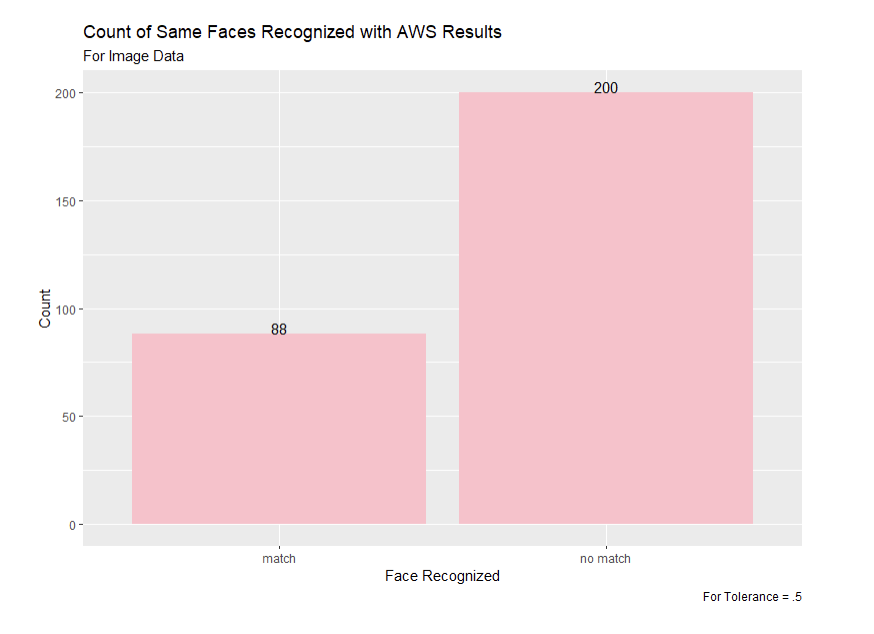
Figure 14: Comparing the Faces Matched Between Snapchat Video Ads with Tolerance of .5 and AWS Results
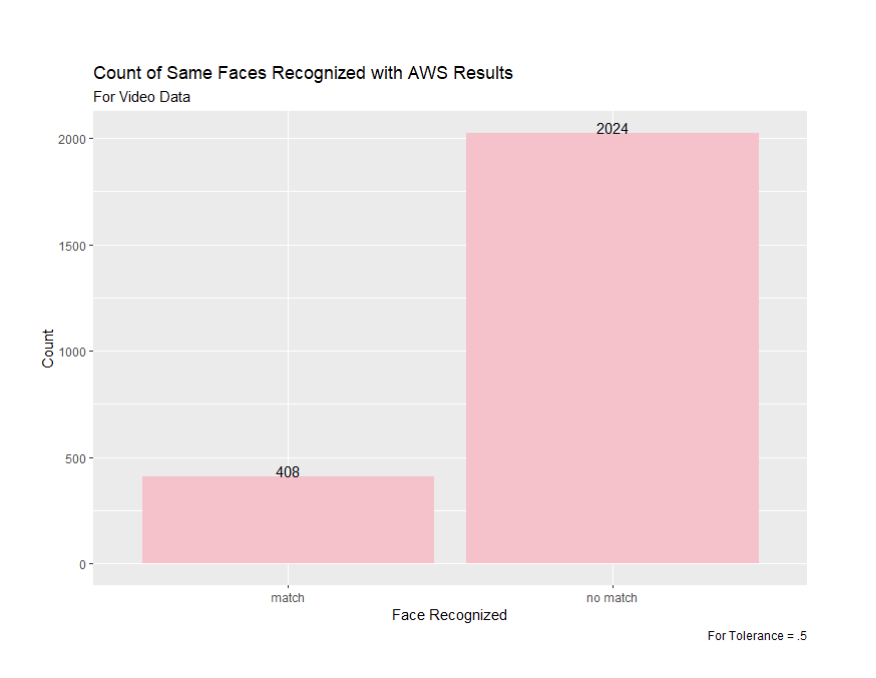
Figure 15: Comparing the Faces Matched Between Snapchat Image Ads with Tolerance of .6 and AWS Results
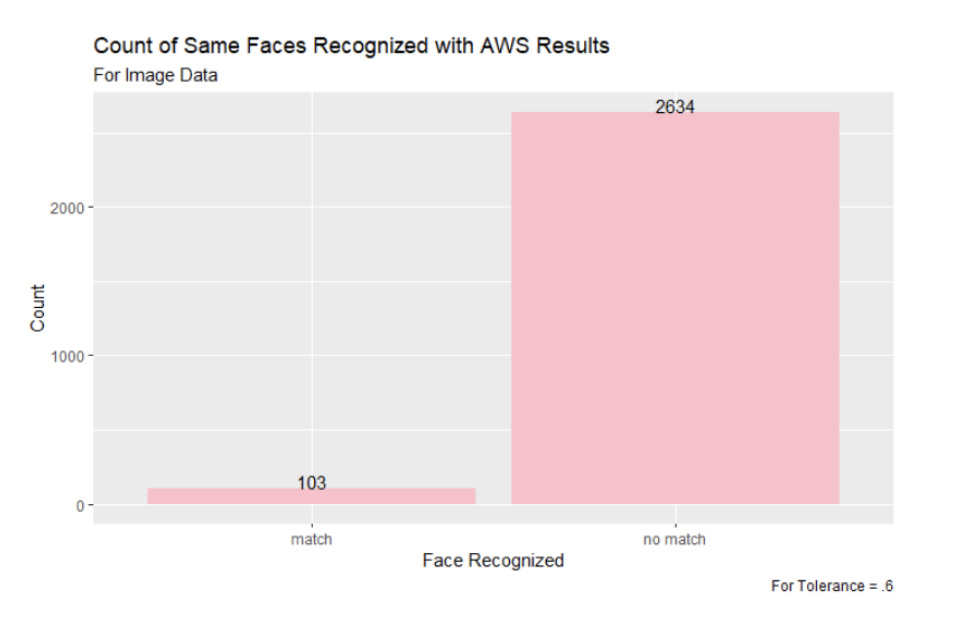
Figure 16: Comparing the Faces Matched Between Snapchat Video Ads with Tolerance of .6 and AWS Results
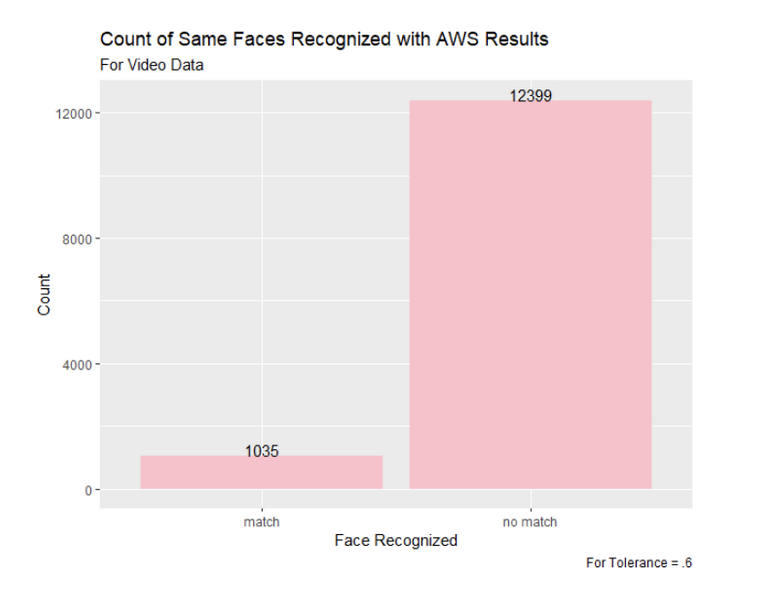
Figure 17: Comparing the Faces Matched Between Snapchat Image Ads with Tolerance of .7 and AWS Results
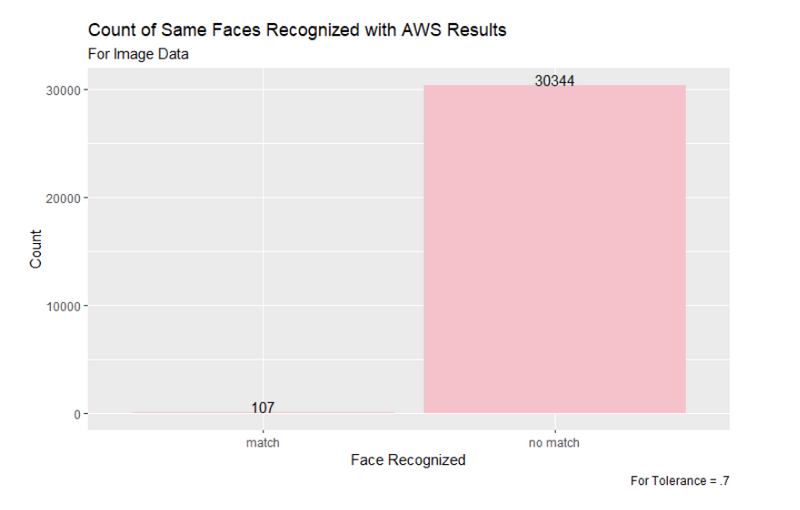
Figure 18: Comparing the Faces Matched Between Snapchat Video Ads with Tolerance of .7 and AWS Results
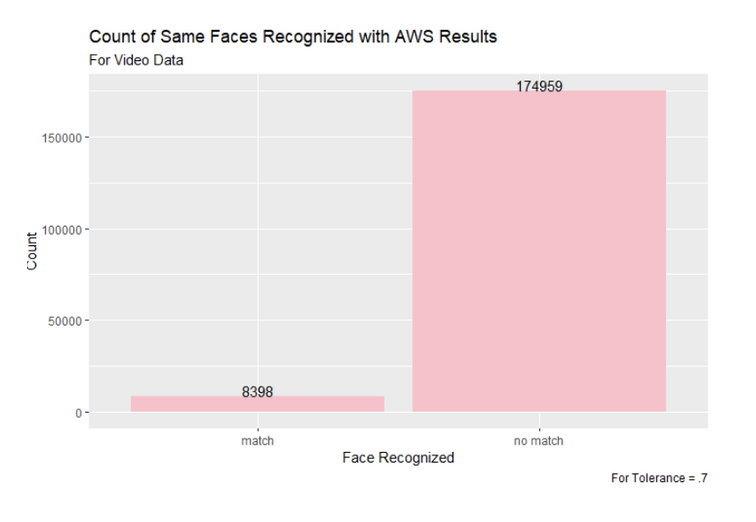
Figure 19: Top Faces Recognized in Snapchat Ad Images Compared to AWS
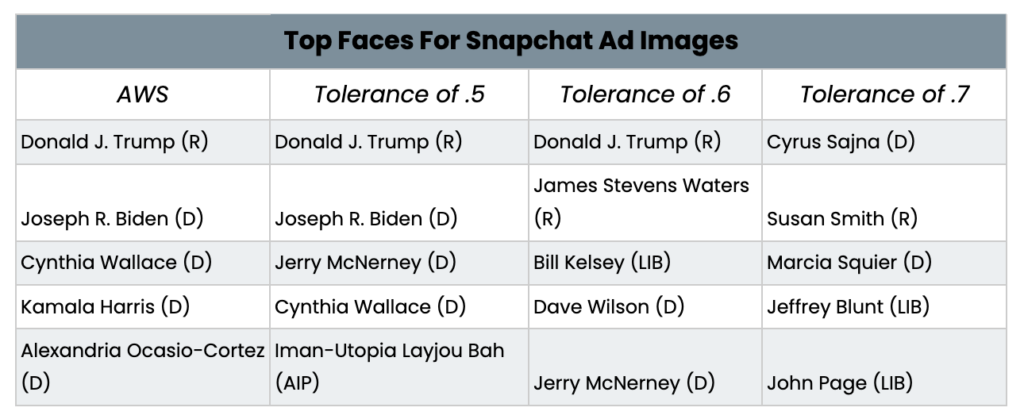
From these image results, we can see that the 0.5 tolerance was the closest to the results from the AWS facial recognition. The 0.7 tolerance appears to be too lenient in matching faces, so using the stricter tolerance value of 0.5 will be the most useful moving forward. The 0.5 tolerance was able to identify the top two most commonly recognized faces by the AWS program—Donald J. Trump and Joseph R. Biden—and also identified Cynthia Wallace among the top five faces, which neither the 0.6 or 0.7 tolerance were able to do.
While the 0.6 default tolerance also had Donald J. Trump as the most commonly recognized face, the remaining four in the top five faces for the default tolerance were not on the AWS list. All of the faces in the 0.7 tolerance were not among the top five most recognized faces from the AWS dataset.
Figure 20: Top Faces Recognized in Snapchat Ad Videos Compared to AWS
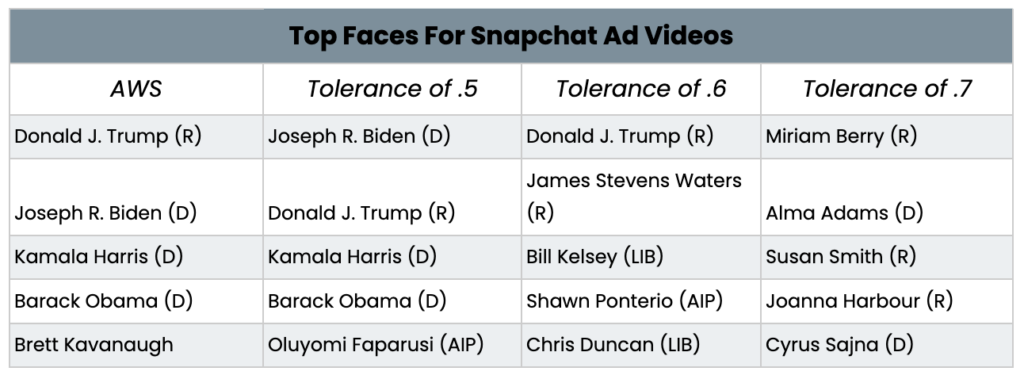
From this video results comparison, we see that the 0.5 tolerance is once again the most accurate when compared to the existing AWS results. While the first two most commonly recognized faces were switched between the AWS results and the 0.5 tolerance, the third and fourth most recognized faces, Kamala Harris and Barack Obama, were the same for the 0.5 tolerance with the open source algorithm we used. For tolerance 0.6, while Donald J. Trump was the most recognized, as in the AWS results, the remaining four recognized faces were different from the AWS results. All five of the most recognized faces for the video results with a tolerance of 0.7 were different from the AWS video results.
Overall, based on the results from the 0.5 tolerance, we found that Donald J. Trump appeared in the most image ads, while Joseph R. Biden appeared in the most video ads. The 0.5 tolerance was the closest in accuracy to the AWS results in identifying faces for both Snapchat images and video key frames.
Conclusion
Overall, by using AWS as the base results, we were able to examine how the open source facial recognition software compared. Our analysis of the facial recognition software with various tolerance levels allows us to conclude that the 0.5 tolerance seems to be the most accurate in correctly identifying faces. This research is useful moving forward with more Snapchat analysis for both images and videos, since we know which tolerance level is the most accurate for open source software and how open source facial recognition algorithms compare to AWS.
In addition to the key frame method of pulling frames from videos, we also used a different means of extracting frames from videos so that we could compare these results to the AWS dataset. This technique took 10 frames for each second of the videos from the Snapchat videos folder. Unfortunately, due to the substantial amount of data that this program generated, we were unable to apply the facial recognition software to it. However, the data is readily available for future analysis.
Works Cited
Geitgey, A. (2020, September 24). Machine learning is fun! part 4: Modern face recognition with deep learning. Medium. Retrieved May 18, 2022, from https://medium.com/@ageitgey/machine-learning-is-fun-part-4-modern-face-recognition-with-deep-learning-c3cffc121d78
N. Dalal and B. Triggs, “Histograms of oriented gradients for human detection,” 2005 IEEE Computer Society Conference on Computer Vision and Pattern Recognition (CVPR’05), 2005, pp. 886-893 vol. 1, doi: 10.1109/CVPR.2005.177.
Zhujunnan. (n.d.). Zhujunnan/shotdetect: To find the key frame of a video. GitHub. Retrieved May 18, 2022, from https://github.com/Zhujunnan/shotdetect

