Tracking Facebook ad references to the pandemic from candidates and their affiliated pages
By Conner Sexton and Spencer Dean
Introduction
Presidential campaigns, including leadership PACs and single-candidate super PACs, have spent upwards of $185 million on Facebook advertisements since the beginning of 2019, as reported by the Wesleyan Media Project. By comparison, $751 million has been spent on TV ads from all sponsors in the presidential race. In recent weeks, as a narrowing of the field coincided with the COVID-19 pandemic, the volume of TV advertisements seems to have decreased significantly.
Co-director of the Wesleyan Media Project Michael Franz acknowledged that there may be a “coronavirus effect” contributing to the current landscape of political advertising. “Campaigns may be sensing that the mood of the country is one in which people do not want to think about politics—or they have more pressing concerns on their minds,” Franz said. Furthermore, it seems like the plummeting of Facebook’s ad prices (15% to 20% decline between February and March), has not incentivized increased ad activity as much as expected.
To better understand the effect COVID-19 has had on Facebook’s political advertisements, we sought to research the frequency and content of coronavirus-related ads from presidential candidates. Data used in this analysis came directly from the Wesleyan Media Project, which tracks advertising through Facebook’s Ad Library API tool.
Methodology — Keyword Selection
Our first task in querying the data was coming up with a list of keywords which, when searched for in ad text*, would return all coronavirus-related advertisements. The final list of keywords we selected include: pandemic, protective equipment, social distanc(e|ing), covid, corona(|virus), respirator, wuhan, quarantin(e|ed), virus, and n95 mask. Our approach to keyword selection was two-pronged. First, we wanted to determine which words most frequently appeared in coronavirus news coverage to supplement our initial brainstorm (which included the obvious: “coronavirus,” “covid-19,” etc.). For this task we built a simple web scraper using rvest, a package for R which allowed us to “harvest” data from html web pages. We used this R script to pull text data from CNN.com, which has been publishing daily web pages that compile all of the site’s coronavirus news for that date (for example: March 20 coronavirus news). Our web scraper iterated over two months of data (pages from January 26 through March 26) and pulled an average of 1000 words per day from CNN’s posts. Next, we performed a term frequency analysis on the resulting corpus. This exercise helped us identify several frequently occuring words, such as “Wuhan” and “quarantine,” which would later be useful in querying the Facebook data.
Our approach to keyword selection was two-pronged. First, we wanted to determine which words most frequently appeared in coronavirus news coverage to supplement our initial brainstorm (which included the obvious: “coronavirus,” “covid-19,” etc.). For this task we built a simple web scraper using rvest, a package for R which allowed us to “harvest” data from html web pages. We used this R script to pull text data from CNN.com, which has been publishing daily web pages that compile all of the site’s coronavirus news for that date (for example: March 20 coronavirus news). Our web scraper iterated over two months of data (pages from January 26 through March 26) and pulled an average of 1000 words per day from CNN’s posts. Next, we performed a term frequency analysis on the resulting corpus. This exercise helped us identify several frequently occuring words, such as “Wuhan” and “quarantine,” which would later be useful in querying the Facebook data.
These keywords helped inform our next approach, which involved querying the Facebook data itself to identify pairs/triplets of consecutive words, or “bigrams/trigrams.” This process involved a sliding window over the text content of each ad, capturing phrases such as “virus will spread” and “protective equipment.” By utilizing n-gram keywords, we were able to reduce the amount of false positives captured. For example, the term “spread” casts a much wider net than “virus will spread.”
Lastly, we underwent a series of trial-and-error phases to determine which words should and should not be used in the final query. For example, through examining advertisements caught by preliminary search term lists, we ruled out the use of keywords like “ppe” (personal protective equipment) and “public health.” As shown below, searching for “ppe” in ad text returned false positives where posts contained words like “happen” or “stopped.” We weighed the option of appending spaces at either end of the keyword, so that “ppe” would not be matched within other words, but ultimately decided on using “protective equipment” instead of the acronym.
A large number of false positives were also included when searching for “public health,” since many candidates ran ads discussing the healthcare system while not specifically addressing coronavirus.
Though time-intensive, this thorough process of keyword selection allowed us to have confidence in the final query’s optimal balance of accuracy and specificity in extracting coronavirus-related ads.
Figure 1: Coronavirus Keyword Matches Within Advertisement Text Fields
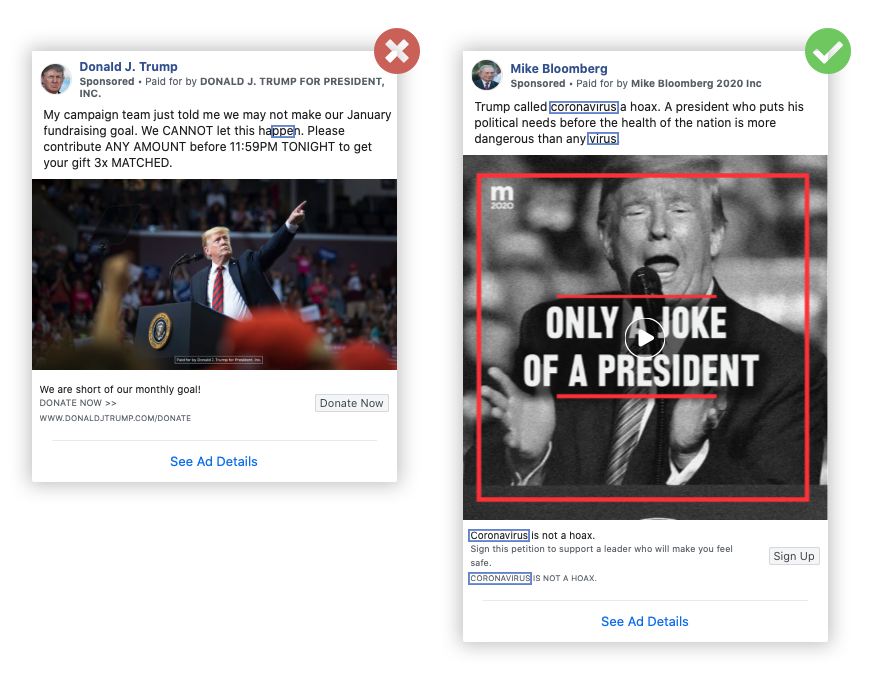
Figure 2: Coronavirus Mentions in All Political Facebook Advertisements By Week
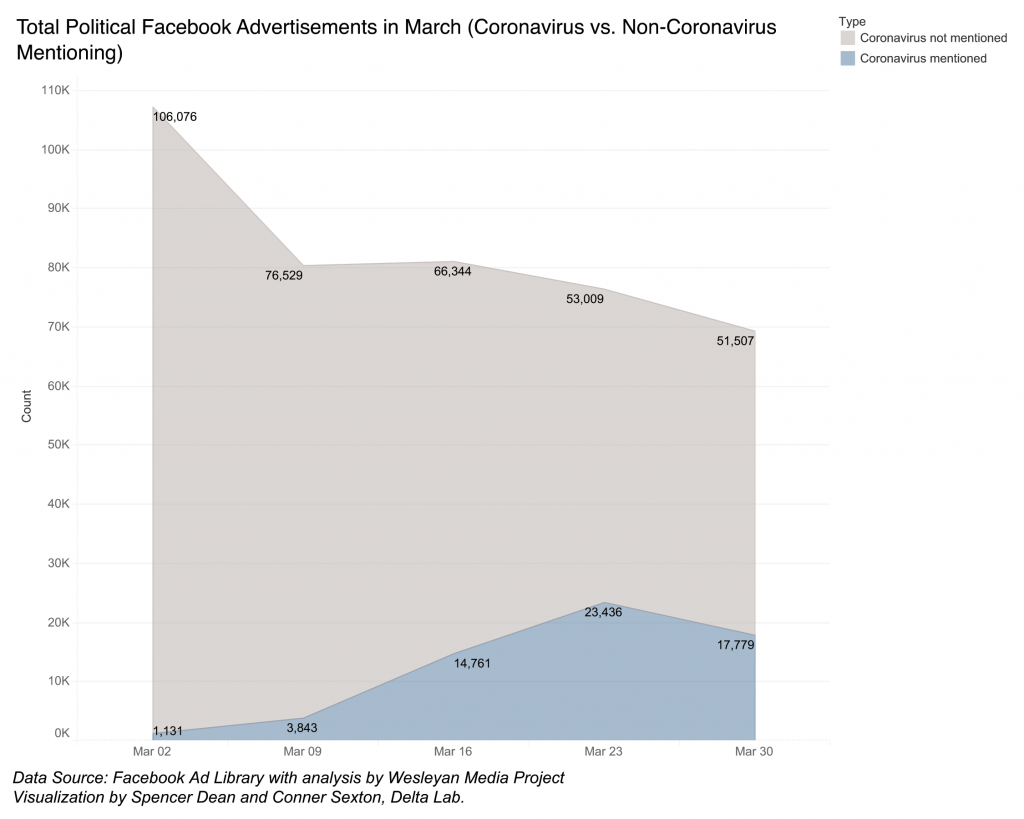
At first glance, the quantity of Facebook ads referencing coronavirus sharply increased during the weeks of March 9th, 16th, and 23rd. These dates coincide with the WHO’s declaration of COVID-19 as a global pandemic and U.S. federal and state governments declaring states of emergency. Aside from these specific events, the large uptick in ads can largely be attributed to the rapid escalation of positive coronavirus cases globally.
For a closer look at how coronavirus coverage evolved over the timeframe, we analyzed the frequency of specific keyword occurrences within all advertisements from the Facebook Ad Library API. The results of this analysis are displayed in Figure 3. The most common keywords associated with coronavirus ads were “virus,” “coronavirus,” and “pandemic.” The trend in these specific words mostly mirrors the overall curve shown in Figure 2.
Some Facebook pages, like SmartNews, produce large volumes of advertisements promoting news coverage. In order to understand how the pandemic is being addressed in the political ad landscape, it is thus necessary to filter out these pages and focus solely on presidential candidate pages and their affiliated PACs. To perform this analysis we used a list of page names and disclaimers maintained by the Wesleyan Media Project (click here to download). The results of our presidential candidate analysis are discussed below.
Results — Ads from Candidate Pages
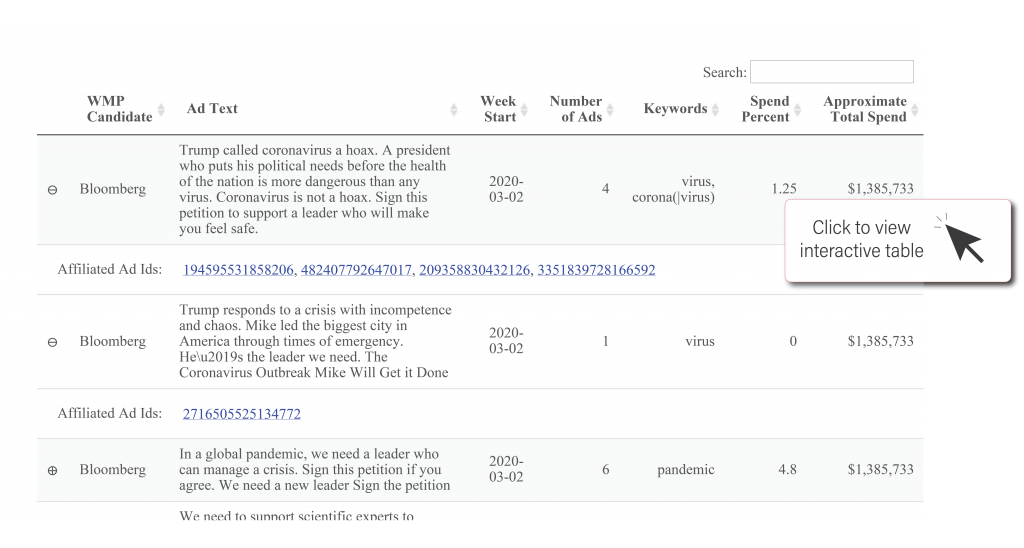
In summarising coronavirus mentions across 2020 presidential candidates, we paid particular attention to Mike Bloomberg, Joe Biden, and Donald Trump*. As displayed in Table 1, during the week of March 2nd, Bloomberg ran 22 advertisements mentioning coronavirus, with 9 distinct messages (ad_text). Those 22 ads accounted for roughly 10.2 percent of Bloomberg’s Facebook advertising spend for that particular week. Most of these ads encourage the viewer to engage with Bloomberg’s campaign through signing a petition or joining a mailing list (see Trump called coronavirus a hoax). While Trump did not run any coronavirus related ads throughout March, Great America PAC, a Super PAC that supported Trump in his 2016 campaign and during his current bid for re-election, aired 8 ads mentioning coronavirus during the week of March 23rd. These ads prompted individuals to rate Trump’s leadership during the pandemic (see America’s at war with a virus) and accounted for roughly 23.5 percent of the page’s ad spend for that week. Finally, Biden only mentioned the coronavirus in ads that made up roughly 1 percent of his overall ad spend during the week of March 23rd. While Biden released only 3 distinct messages across 6 coronavirus related advertisements, each encouraged individuals to donate to his campaign (see In times of uncertainty).
Figure 3: Coronavirus Search Term Frequency By Week
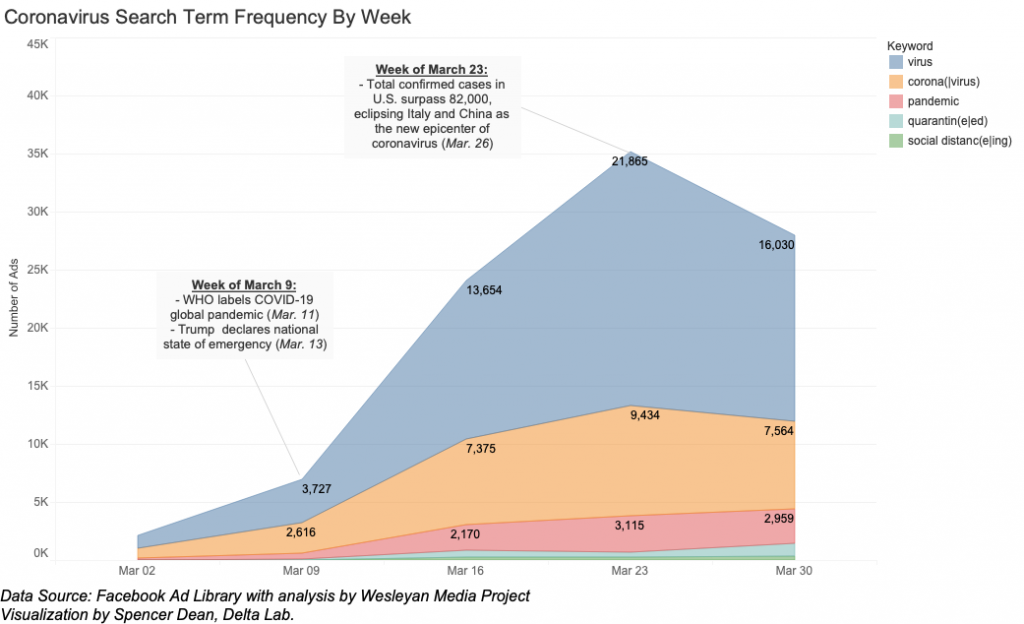
Table 1: Unique Creatives from Candidate/PAC Ads Mentioning Coronavirus
To better determine candidate activity on Facebook, we investigated the percentage of total ad spending and the total number of impressions of candidates’ coronavirus-related ads. Since pages can run particular ad creatives with varying frequencies, this spend and impression information would ideally paint a more accurate picture of candidate coronavirus coverage.
As displayed in Table 2, to achieve this we first aggregated all ads for a given entity across the time series (March 2 through April 5) and calculated ranges** for their impressions and spend. Then, we performed the same calculations but just for ads which had been caught by our coronavirus keyword searches. Comparing these ranges allowed us to identify the percentages of an entity’s total spending and impressions that were made up of coronavirus-related advertisements.
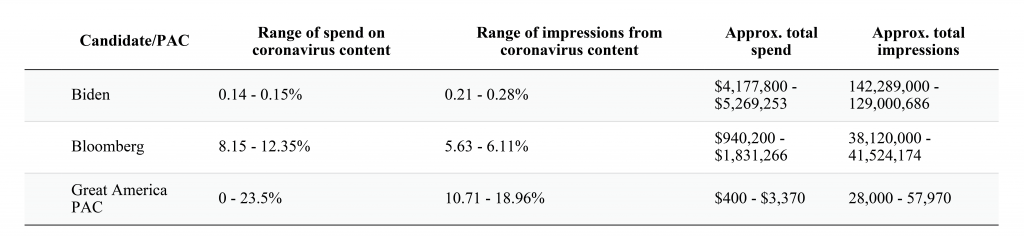
Like the previous results, Table 3 indicates that Biden produced some coronavirus advertisements, but spent less than 1 percent of his ad budget for March and early April on these particular ads. The number of impressions these ads produced was similarly low, at less than 1% of the total. In general, this was a period of increased spending for the democratic frontrunner, as Biden’s page spent about $5.6 million on the platform according to Facebook’s Ad Library Report.
For Great America PAC, the percentages of spending and impressions associated with coronavirus-related advertisements were much higher (as high as 24 percent of spending and between 11 and 19 percent of impressions). However, the total amount spent by this pro-Trump page for the time period was under $3,500.
Table 2: Summary of Candidate/PAC Activity in March and Early April
*Our keywords did not pick up any COVID-19 related advertisements from pages affiliated with the 2020 Sanders campaign.
**See Methodology — Calculating Impression & Spend Percentages
Conclusion
The remaining major presidential candidates, along with leadership PACs and single-candidate super PACs, have produced very few Facebook advertisements that mention the coronavirus. Trump, who spent $2.4 million on Facebook since March 8, never mentioned the coronavirus in the data we collected. Great America PAC (a pro-Trump group) did spend a small amount of money — under $3,500 — on Facebook in late March, and as much as 24 percent of this sum was devoted to coronavirus-related ads. Towards the end of the month, Biden also began running coronavirus-related advertisements. However, the amount spent on these ads constituted under 1 percent of Biden’s overall Facebook ad spending after March 1.
While the impact of coronavirus does not seem to have slowed presidential campaign advertising on Facebook as much as on TV, there does seem to be limited reference to the pandemic itself by candidates on the platform. The Wesleyan Media Project and Delta Lab will continue to track this evolving issue.
Authors:


Methodology — Calculating Impression & Spend Percentages
Individual ad data from Facebook’s ad library API reports impressions and spend as ranges rather than exact numbers. For example, a particular ad might have a reported spend of between 0 and 99 dollars (lower_spend = 0, upper_spend = 99) and a reported impressions range between 0 and 999 (lower_impressions = 0, upper_impressions = 999). In order to approximate the percentage of overall spend on coronavirus related advertisements, we simply take the sum of the reported lower and upper spend for ads matched by our keywords, then divide these values by their respective upper and lower spend on all ads. As reflected in Table 3, these calculations are performed for each page independently for both spend and impressions.