
In Facebook’s Ad Library, Facebook reports spending on political advertisements by day, week, 30-day, and 90-day summaries, and total spending to date by Facebook Page and Disclaimer (for example, Page: Donald J. Trump, Disclaimer: TRUMP MAKE AMERICA GREAT AGAIN COMMITTEE).
Through long-term monitoring of the Facebook reports, we became aware that not every day’s numbers can be trusted the same. An analyst or a reporter who decides to use a daily download from Facebook may be in for an unpleasant surprise.
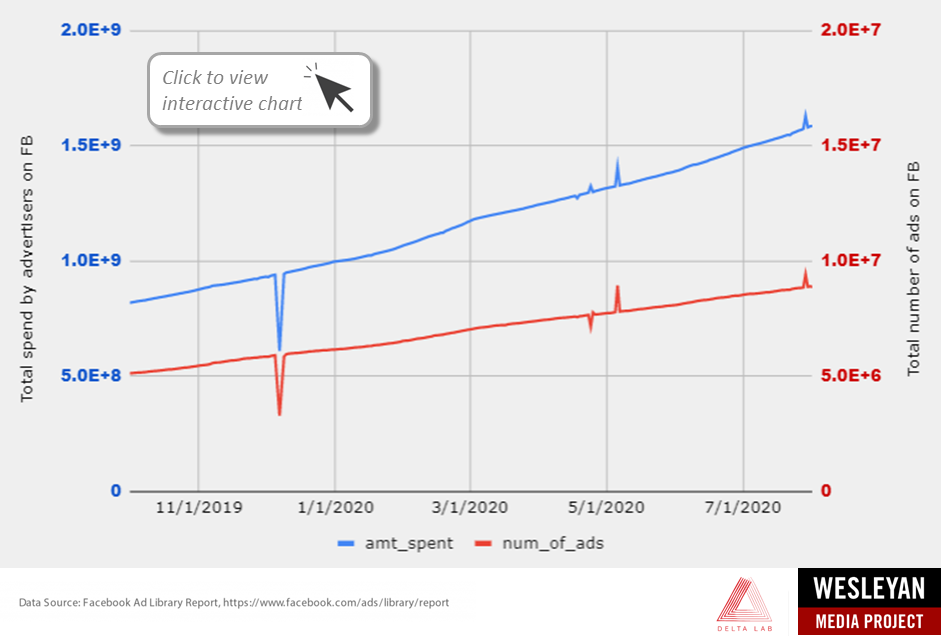
Figure 1 shows total spending by advertisers on Facebook and total number of ads reported by Facebook in its daily reports. The total spending is shown in blue, the total number of ads – in red. Common sense tells us that the cumulative numbers cannot go down, as time progresses, yet the chart shows that this happened in Facebook reports on more than one occasion. Recently, we have been seeing a trend when the reported numbers show unwarranted spikes.
The huge downward spike on December 7, 2019, was noticed by the news media around the world because it affected the reporting on the UK elections. You can read a background story here. On that day Facebook “lost” over $300M in spending. On April 18, 2020, Facebook “lost” $10.5M, and on May 6, 2020 it over-reported $80M in advertiser spending.
Figure 1: Facebook total spending and ads, as reported daily by Facebook
Click here to read more about how we collect and maintain the data featured in this post.
This post is an update of a post originally published May 28, 2020 on this site.